CoinPerps
When the upstreams fail, the product still has to serve.
CoinPerps unifies live market data from more than twenty exchanges and half a dozen news sources into one normalized stream. The hard constraint is not throughput. It is that upstream failure is the steady state rather than the exception. Exchanges go down, rate limit, drop connections and send malformed payloads, and the product still has to serve a coherent view of the market.
The number worth explaining is the 5M events a day. That is the count after dedup, sequence reconciliation and coalescing, not raw inbound. Order book delta streams alone run an order of magnitude above trade volume on an active exchange. The pipeline's actual job is compressing that firehose down to the state changes worth persisting and pushing, so the filtering ratio is the more interesting fact than the headline number.
The value I added
- A product that keeps serving during exchange outages, which is the entire commercial promise of a market data aggregator.
- One normalized schema across 20+ venues, so every downstream feature is built once instead of per exchange.
- Sub-second delivery at p99, which is what makes traders treat the numbers as live rather than indicative.
- An architecture where adding the twenty-first exchange is a connector, not a refactor.
What I owned
The ingestion, normalization and real-time delivery pipeline end to end: the connector layer, the event spine, the aggregation logic, and the WebSocket fan-out to clients. 20+ exchange connectors and 6+ news pollers running as independent processes, sustaining around 5M normalized events a day with 10x to 20x bursts during liquidation cascades and macro prints.
the two rules
Never trust someone else's clock, and never guess at a gap.
Every exchange has its own idea of what a tick looks like and what time it is. Exchanges have been observed sending timestamps seconds out. So every normalized event carries two timestamps: the exchange-reported one, kept for display and debugging and trusted for nothing, and a server-authoritative receive time assigned by our own clock. Ordering and staleness decisions are made only on the authoritative one. That single decision removes an entire category of cross-exchange ordering bugs caused by trusting third-party clocks.
The second half is sequence integrity. Where an exchange gives sequence numbers, the connector buffers deltas, fetches a REST snapshot, discards anything at or below the snapshot sequence, and applies the rest in order. If a gap appears later, the book is marked stale and resynced rather than quietly continuing on state that might be wrong. Where an exchange gives no sequence numbers, correctness is weaker by necessity, so staleness is instead bounded by a forced periodic resnapshot.
what it already handles
designed-for, not hoped-forSequence gap
Delta sequence jumps by more than one
Never continues on a book that might be wrong.
Exchange goes dark
Heartbeat timeout, then sustained
Degraded in one source, not down as a platform.
Malformed payload
Schema validation fails at the boundary
One bad message never kills the connection.
Volatility burst
Tick rate 10x to 20x normal
The critical path degrades last.
Client reconnects
Network blip on the client side
No silent gap from the client's point of view.
failure modes
what breaks, and what happens next| Failure | How it is caught | What happens next |
|---|---|---|
| Exchange WebSocket disconnects | heartbeat timeout | Exponential backoff with jitter. The connector is marked degraded after two missed cycles, and clients see an explicit staleness flag rather than frozen values that look live. |
| Exchange rate limits us | HTTP 429 / throttle msg | Per-exchange token bucket tuned to documented limits. On a 429 the connector reduces its own rate below the threshold rather than retrying straight into the wall. |
| Sequence gap in the delta stream | local seq tracking | Book marked stale, snapshot and delta resync runs, and it stays marked until reconciled. |
| Malformed payload | schema validation | Quarantined to a dead-letter topic with the raw payload kept for inspection. The connector keeps processing. |
| Kafka partition unavailable | producer ack timeout | Bounded local buffer with disk-backed overflow, then drop-oldest with alerting past a hard cap. Consumers resume from their last committed offset, so delivery is at-least-once and consumers apply idempotently. |
| Crossed book, bid above ask | aggregator sanity check | Excluded from the composite price rather than allowed to skew it. Kept in raw storage for later analysis. |
| Full exchange outage | connector down status | That exchange is dropped from composite calculations and marked unavailable to clients. The platform feed continues, which is the literal implementation of the product promise. |
what it is held to
why I chose what I chose
expand any decisionWhy Kafka here, when other systems I build use SQS?
This pipeline needs ordered, replayable delivery per symbol, with consumer-group scaling and enough retention to backfill. Kafka's partition-per-symbol-hash gives ordering where it matters without a global bottleneck. Redis Streams has weaker replay semantics and couples durability to Redis memory behaviour. RabbitMQ is queue-shaped rather than log-shaped, which makes reprocessing awkward.
Why one process per exchange?
Node's event loop is vulnerable to being blocked by CPU-bound JSON parsing during a tick burst. Isolating each exchange in its own process means a slow parse on one cannot delay another, and normalization moves to worker threads when queue depth crosses a watermark. It is also the infrastructure expression of the isolation principle the whole product depends on.
Why ClickHouse for tick history?
The workload is append-only, very high write volume, and read as wide analytical queries like a VWAP across exchanges over four hours. That is a columnar store's shape, not a row store's. TimescaleDB was a close second and lost on ingestion ceiling and compression ratio at this event volume.
Why EKS here when most of what I build runs on Fargate?
Connector scaling needs to react to Kafka consumer lag, which is a custom application metric. That is KEDA territory, and KEDA is native to Kubernetes autoscaling in a way that has no clean equivalent on ECS request-count or CPU-based scaling. The Kubernetes cost is justified by a real requirement here, and it is not the default I reach for elsewhere.
Why is the gateway allowed to run on Spot?
Both the gateway and the connectors already handle abrupt disconnect and resume, because that is what an exchange does to them daily. A Spot interruption is functionally the same event they already recover from, so running them on the cheapest capacity costs almost nothing in extra engineering. The stateful tiers, Kafka and ClickHouse, are bought for stability instead.
what I would reconsider
the honest part- Node.js for the connectors is a velocity and consistency choice, not a performance-first one. It is fine at current scale and it is the first thing I would revisit if per-connector tick rate grew an order of magnitude, starting with worker-thread offload and then a selective rewrite of the highest-volume connectors.
- Redis pub/sub as the fan-out mechanism is simple and fast to build but is not purpose-built for massive WebSocket fan-out. It is the honest first bottleneck in this design, and the path out is a dedicated pub/sub tier that decouples subscriber count from gateway process count.
- At-least-once delivery rather than exactly-once was deliberate. Idempotent consumers make it behaviourally equivalent from the client's side for a market data use case, at a fraction of the engineering cost.
the product
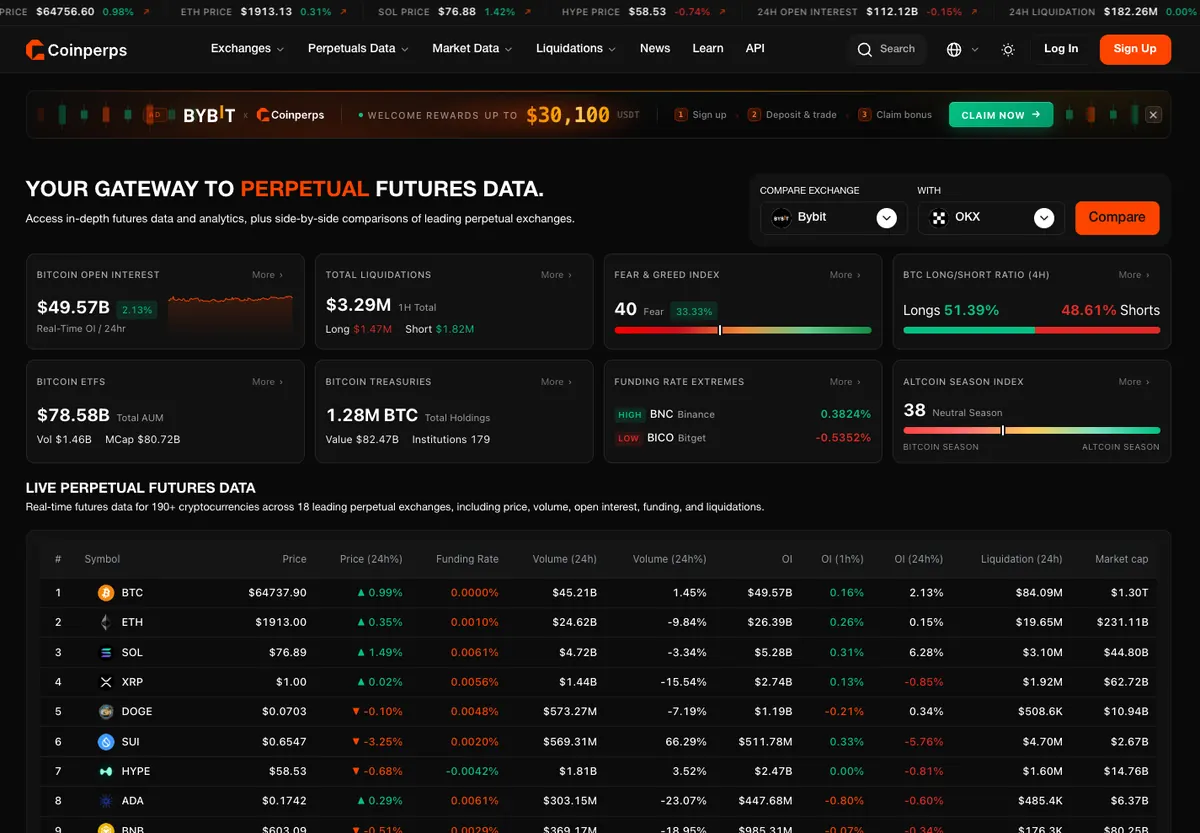
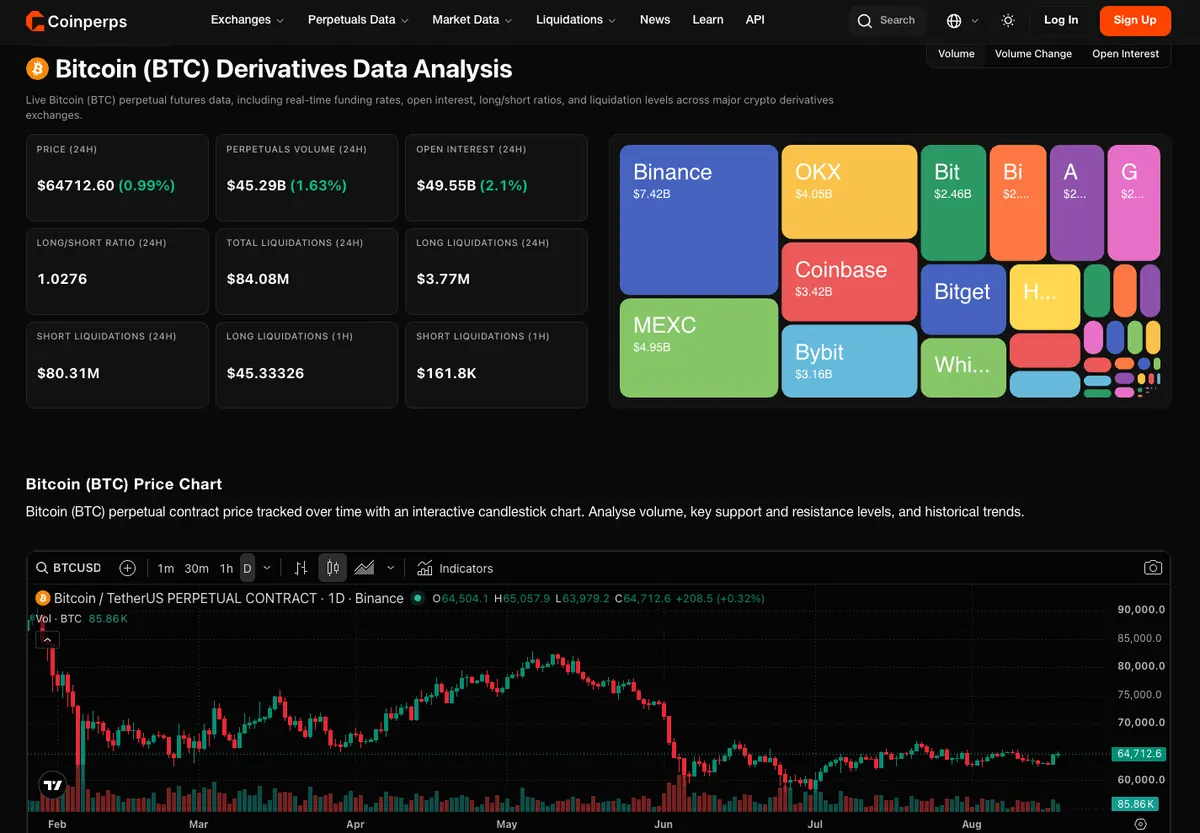
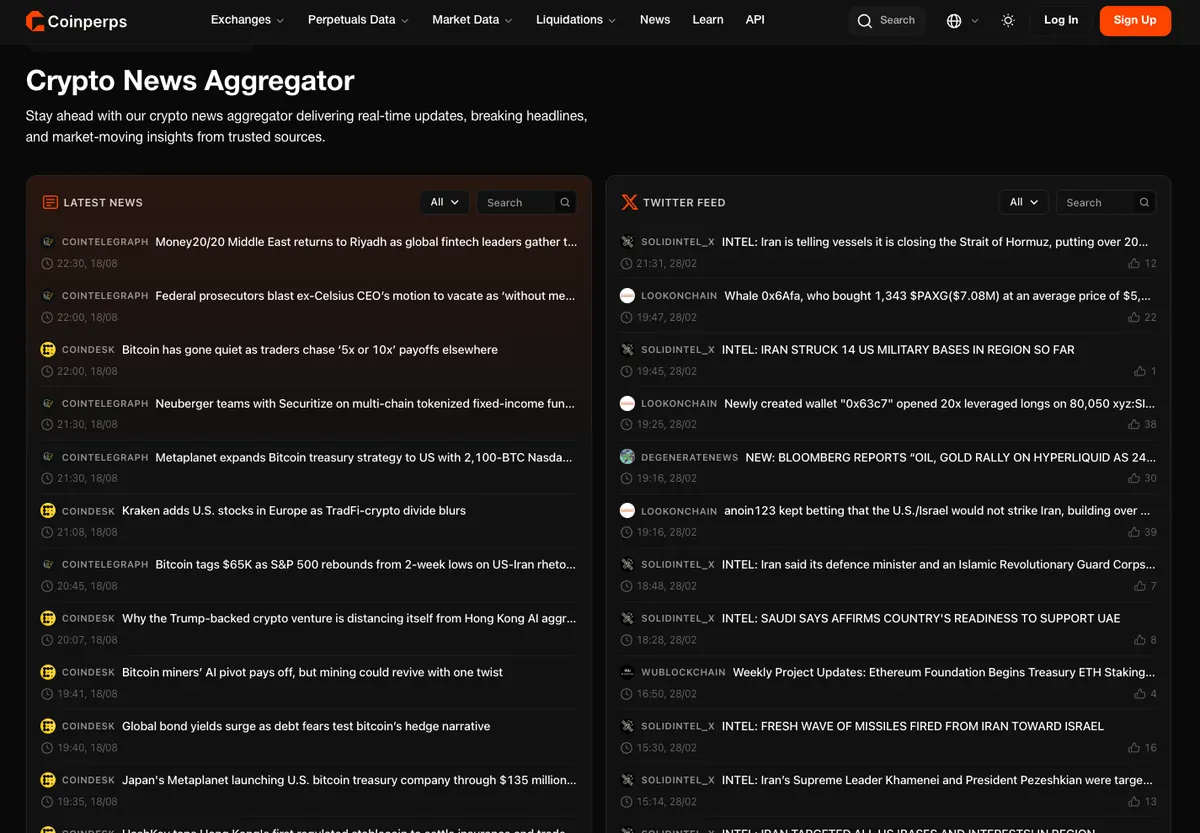
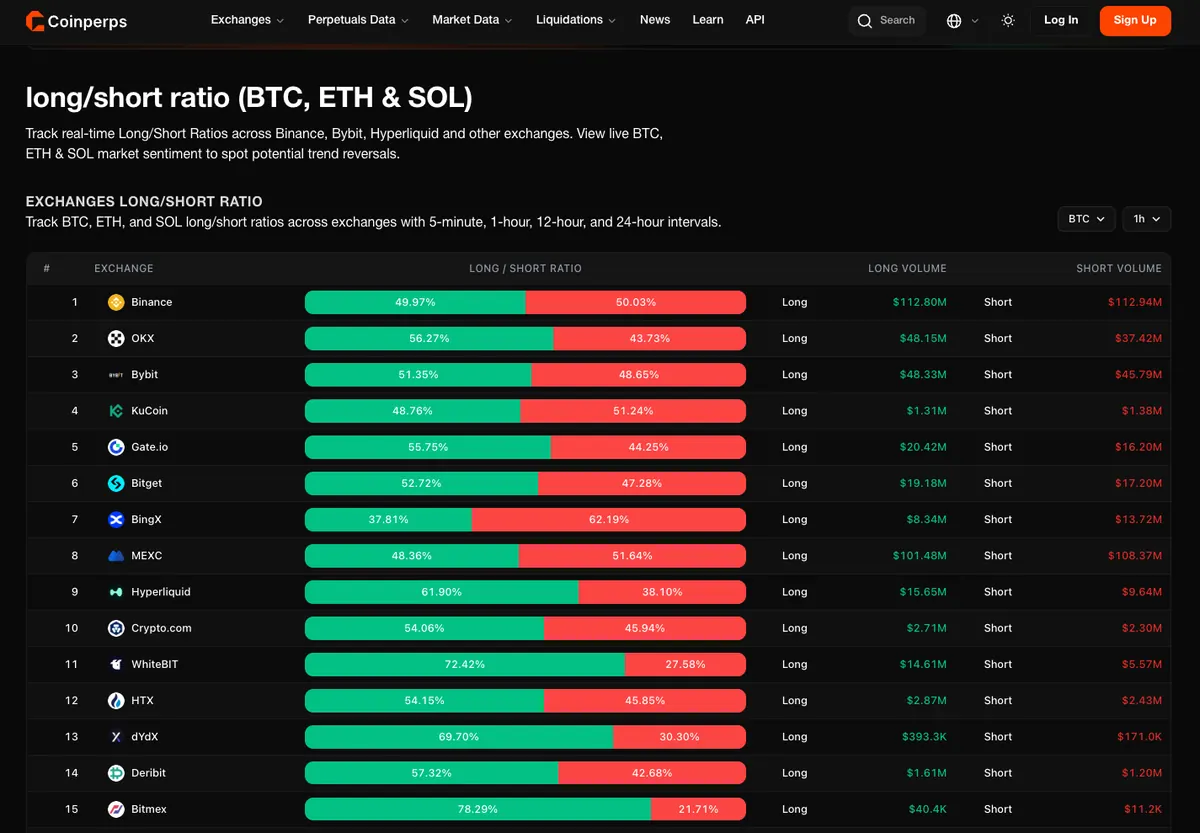
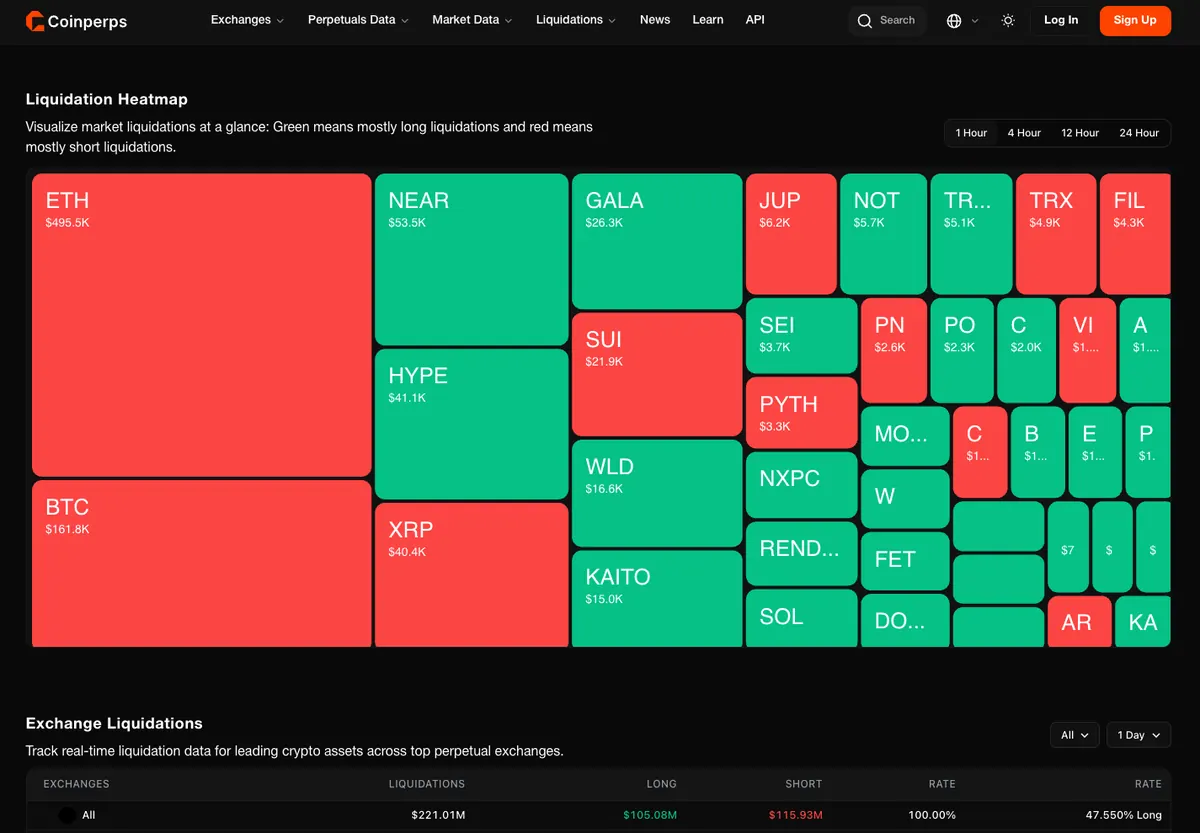
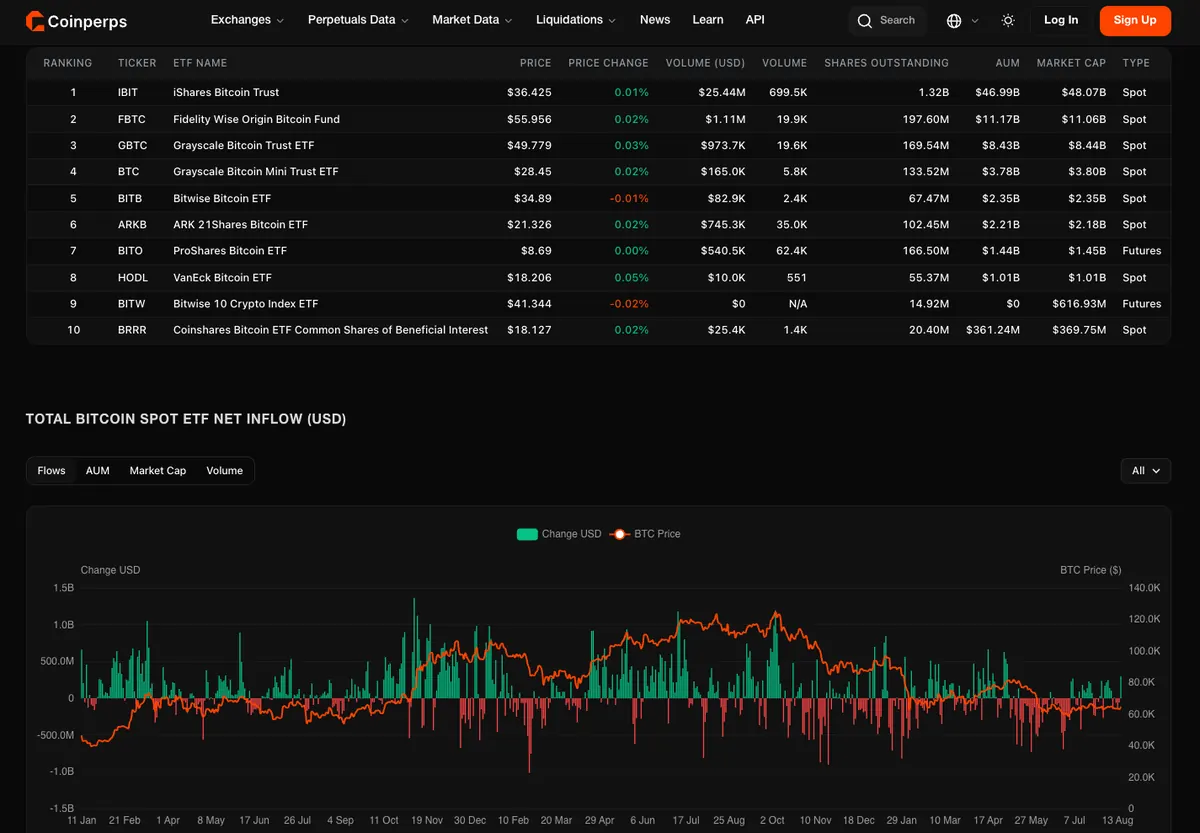
click any shot to enlargeWhat the pipeline feeds. Every number on these screens is a normalized event that survived dedup, sequence reconciliation and a sanity check.
Want the version with the architecture diagrams?
Happy to walk through the connector topology, the Kafka partitioning scheme and the backpressure model on a call.